Note
Go to the end to download the full example code.
Scale bar
The pygmt.Figure.scalebar method can be used to add a scale bar to a map. This
example shows how such a scale bar can be customized.
import pygmt
from pygmt.params import Box, Position
# Create a new Figure instance
fig = pygmt.Figure()
# Mercator projection with 10 centimeters width
fig.basemap(region=[-45, -25, -15, 0], projection="M0/0/10c", frame=["WSne", "af"])
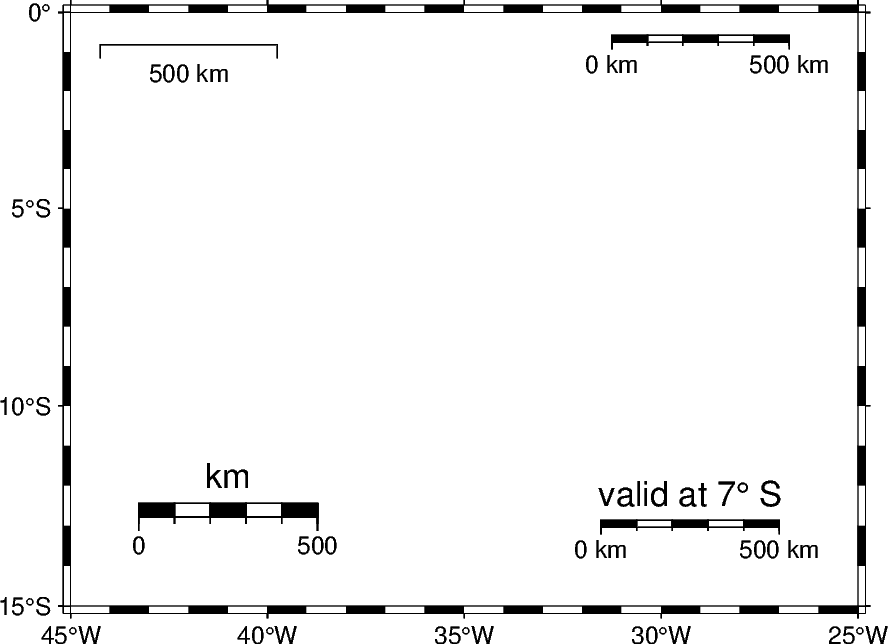
# --- Top Left: Add a plain scale bar ---
# It is placed based on geographic coordinates 42° West and 1° South, applies at the
# reference point by default, and represents a length of 500 kilometers.
fig.scalebar(length="500k", position=Position((-42, -1), cstype="mapcoords"))
# --- Top Right: Add a fancy scale bar ---
# It is placed based on normalized bounding box coordinates. Use a fancy style to get a
# scale bar that looks like train tracks. Add the distance unit to the single distance
# values.
fig.scalebar(
position=Position((0.8, 0.95), cstype="boxcoords"),
length="500k",
fancy=True,
unit=True,
)
# --- Bottom Left: Add a thick scale bar ---
# It applies at the middle of the map (scale_loc is set to True). Use the height
# parameter to adjust the thickness of the scale bar Without providing text, the label
# parameter adds the distance unit as label.
fig.scalebar(
position=Position((0.2, 0.15), cstype="boxcoords"),
scale_loc=True,
length="500k",
height="10p",
fancy=True,
label=True,
)
# --- Bottom Right: Add a scale bar valid for a specific location ---
# It is placed at BottomRight using MiddleRight as anchor point with an offset of 1
# centimeter in both x- and y-directions. It applies at -7° South. A customized label
# is added via the label parameter.
fig.scalebar(
position=Position("BR", anchor="MR", offset=1),
scale_loc=-7,
length="500k",
fancy=True,
unit=True,
label="valid at 7° S",
)
fig.show()
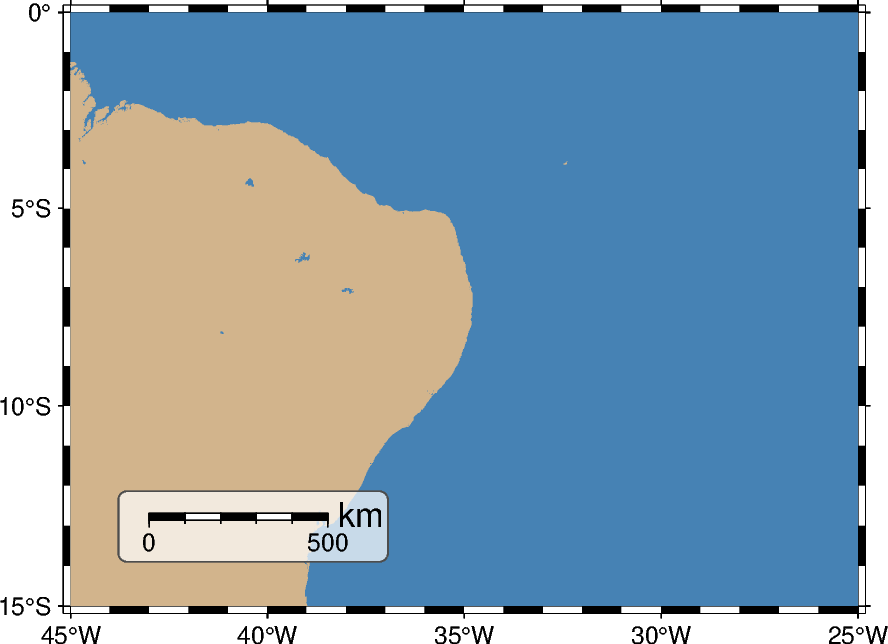
The box parameter allows surrounding the scale bar. This can be useful when adding
a scale bar to a colorful map to improve contrast and readability.
fig = pygmt.Figure()

fig.basemap(region=[-45, -25, -15, 0], projection="M10c", frame=["WSne", "af"])
fig.coast(land="tan", water="steelblue")
fig.scalebar(
    position=Position("BL", cstype="inside", offset=1),
    scale_loc=-7,
    length="500k",
    fancy=True,
    label="km",
    label_alignment="right",
    # Fill the box in white with a transparency of 30 percent, add a solid outline in
    # darkgray (gray30) with a thickness of 0.5 points, and use rounded edges with a
    # radius of 3 points
    box=Box(fill="white@30", pen="0.5p,gray30,solid", radius="3p"),
)

fig.show()
Total running time of the script: (0 minutes 0.330 seconds)