pygmt.Figure.subplot
- Figure.subplot(nrows=1, ncols=1, tag=False, tag_position=None, tag_box=None, tag_orientation=None, tag_number_style=None, tag_font=None, autolabel=False, margins=None, title=None, sharex=False, sharey=False, projection=None, frame=False, region=None, verbose=False, **kwargs)
Manage figure subplot configuration and selection.
This method is used to split the current figure into a rectangular layout of subplots that each may contain a single self-contained figure. Begin by defining the layout of the entire multi-panel illustration. Several parameters are available to specify the systematic layout, labeling, dimensions, and more for the subplots.
Full GMT docs at https://docs.generic-mapping-tools.org/6.6/subplot.html#synopsis-begin-mode.
Aliases:
C = clearance
Ff = figsize
Fs = subsize
B = frame
J = projection
M = margins
R = region
T = title
V = verbose
- Parameters:
nrows (
int, default:1) – Number of vertical rows of the subplot grid.ncols (
int, default:1) – Number of horizontal columns of the subplot grid.figsize (list) – Specify the final figure dimensions as [width, height].
subsize (list) – Specify the dimensions of each subplot directly as [width, height]. Note that only one of
figsizeorsubsizecan be provided at once.tag (
str|bool, default:False) –Specify automatic tagging of each subplot. It can accept a number, or a letter. The number or letter can be surrounded by parentheses on any side if these should be typeset as part of the tag. This sets the tag of the first, top-left subplot and others follow sequentially. If set to
True, default to"a)".Examples are:
tag="a": tags area,b,c, …tag="1": tags are1,2,3, …tag="a)": tags area),b),c), …tag="(c)": tags are(c),(d),(e), …tag=True: same astag="a)".
tag_position (
Literal['TL','TC','TR','ML','MC','MR','BL','BC','BR'] |Position|None, default:None) –Position of the subplot tag on the plot. It can be specified in two ways:
A 2-character justification code for a position inside the plot, e.g.,
"TL"for Top Left corner inside the plot.A
pygmt.params.Positionobject to fully control the position and offset. Note: therefpointproperty of the Position object must be an two-character justification code, andcstypemust be set to either"inside"or"outside",
If not specified, defaults to Top Left corner inside the plot with the offset default to
("4p", "4p"), i.e., 20% of the FONT_TAG size.tag_box (
Box|None, default:None) –Draw a box around the subplot tag. See
pygmt.params.Boxfor details on how to specify the box.Notes on the use of the ``Box`` class:
The property
clearanceonly accept one or two values.The properties
inner_pen,inner_gap,radiusare not supported.
tag_number_style (
Literal['arabic','roman','Roman'] |None, default:None) –Style of the subplot tag numbers. It can be:
"arabic": Arabic numerals: 1, 2, 3, … [Default]."roman": Lowercase Roman numerals: i, ii, iii, …"Roman": Uppercase Roman numerals: I, II, III, …
tag_orientation (
Literal['horizontal','vertical'] |None, default:None) –Orientation of the subplot tag. It can be:
"horizontal": Increase tag numbers horizontally across rows [Default]."vertical": Increase tag numbers vertically down columns.
tag_font (
str|None, default:None) – Font for the subplot tag [Default to"20p,Helvetica,black"].autolabel (
str|bool, default:False) –Specify automatic tag of each subplot.
Deprecated since version v0.19.0: Use the parameters
tag,tag_position,tag_box,tag_number_style,tag_orientation, andtag_fontinstead.clearance (str or list) – [side]clearance. Reserve a space of dimension clearance between the margin and the subplot on the specified side, using side values from w, e, s, or n; or x for both w and e; or y for both s and n. No side means all sides (i.e.
clearance="1c"would set a clearance of 1 cm on all sides). The option is repeatable to set aside space on more than one side (e.g.clearance=["w1c", "s2c"]would set a clearance of 1 cm on west side and 2 cm on south side). Such space will be left untouched by the main map plotting but can be accessed by methods that plot scales, bars, text, etc.margins (
float|str|Sequence[float|str] |None, default:None) –Margin space that is added between neighboring subplots (i.e., the interior margins) in addition to the automatic space added for tick marks, annotations, and labels. The margins can be specified as either:
a single value (for same margin on all sides). E.g.
"5c".a pair of values (for separate horizontal and vertical margins). E.g.,
("5c", "3c").a set of four values (for separate left, right, bottom, and top margins). E.g.,
("1c", "2c", "3c", "4c").
The actual gap created is always a sum of the margins for the two opposing sides (e.g., east plus west or south plus north margins) [Default is half the primary annotation font size, giving the full annotation font size as the default gap].
sharex (
Literal['top','bottom'] |bool, default:False) – Set all subplots in a column to share a common x-range. If set toTrue, the first (i.e., top) and the last (i.e., bottom) rows will have x-annotations. To specify only one of those two rows, use"top"or"bottom".sharey (
Literal['left','right'] |bool, default:False) –Set all subplots in a row to share a common y-range. If set to
True, the first (i.e., left) and the last (i.e., right) columns will have y-annotations. To specify only one of those two columns, use"left"or"right".Notes for
sharex/sharey:Labels and titles that depends on which row or column are specified as usual via a subplot’s own
framesetting.Append +w to the
figsizeorsubsizeparameter to draw horizontal and vertical lines between interior panels using selected pen [no lines].
Notes:
The
sharexandshareyare aliased to the-Scand-Sroptions of the GMT subplot module, which have more modifiers which are not implemented in the current version of PyGMT. If you need more control, you can pass the raw GMT command string to these two parameters as a temporary workaround. For examples,sharex="t+l".title (
str|None, default:None) – Set the overarching heading of the entire figure [Default is no heading]. Font is determined by FONT_HEADING. Individual subplot can have titles set bysharex/shareyorframe.projection (
str|None, default:None) – projcode[projparams/]width|scale. Select map projection.region (str or list) – xmin/xmax/ymin/ymax[+r][+uunit]. Specify the region of interest.
frame (bool, str, or list) – Set map boundary frame and axes attributes.
verbose (bool or str) – Select verbosity level [Full usage].
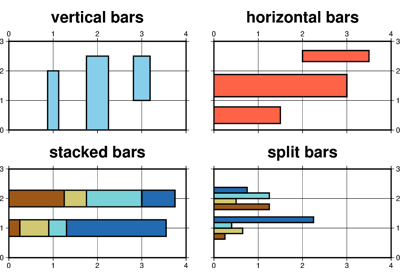
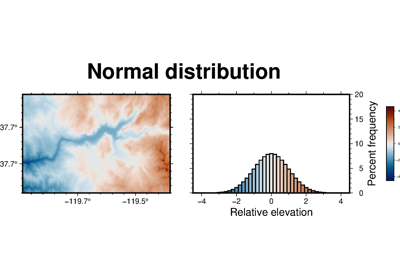
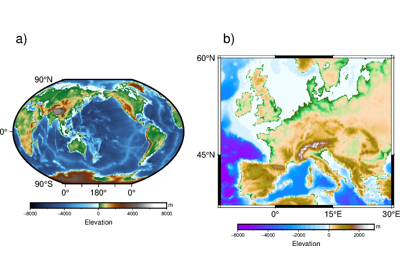
Examples using pygmt.Figure.subplot
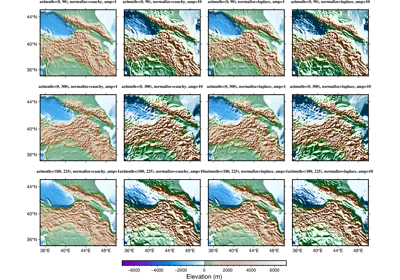
Calculating grid gradient with custom azimuth and normalization parameters